Gross Domestic Product by County and Metropolitan Area, 2023
Manjula.Nangunuri
Wed, 12/04/2024 - 08:30
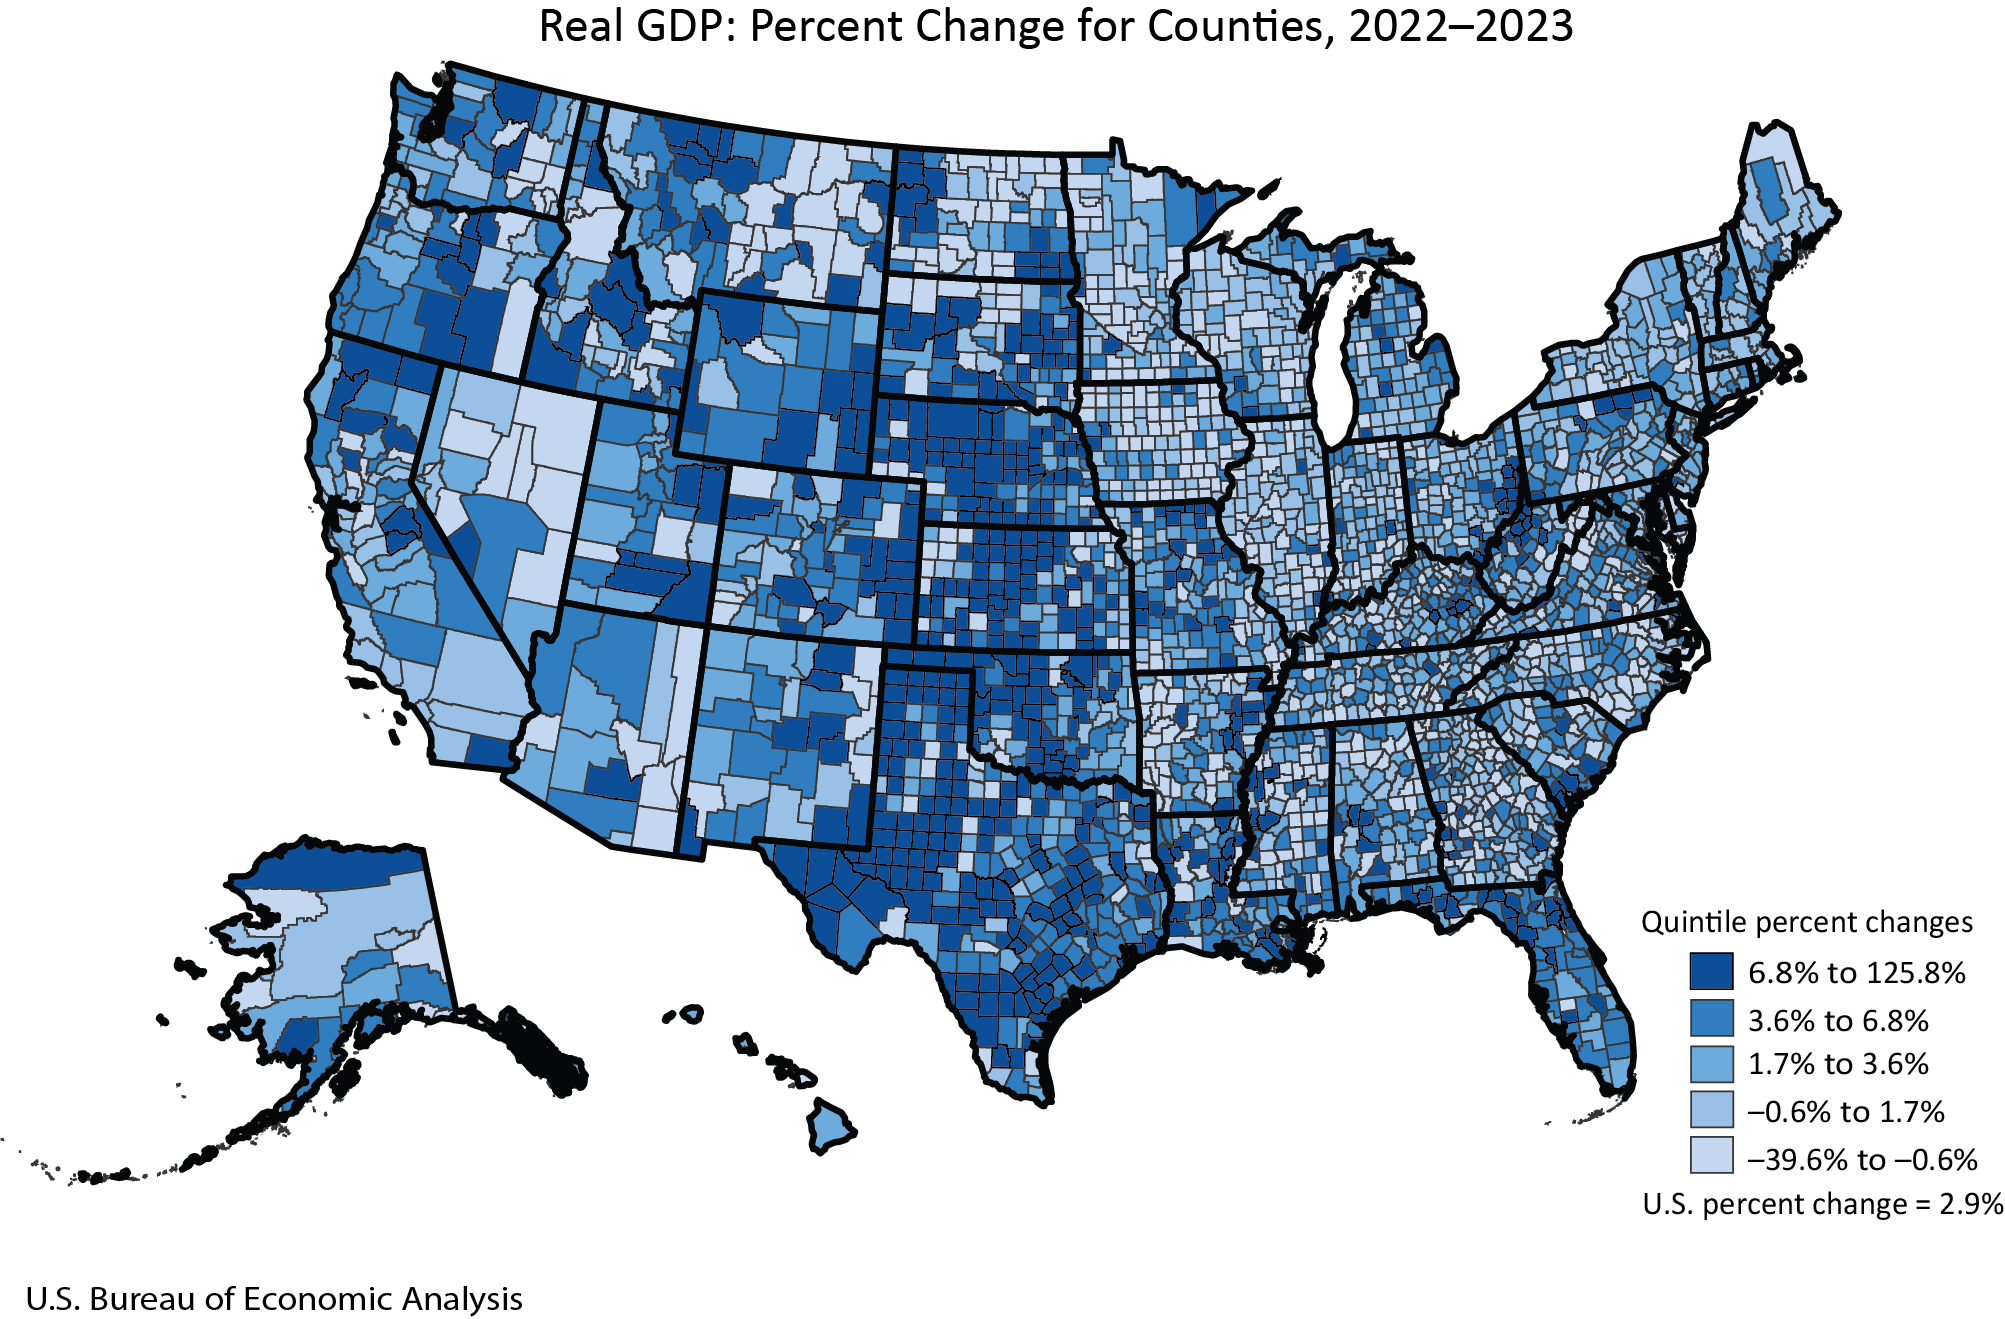
In 2023, real gross domestic product (GDP) increased in 2,357 counties, decreased in 734 counties, and was unchanged in 23 counties. The percent change in real GDP ranged from 125.8 percent in Throckmorton County, TX, to –39.6 percent in Lincoln County, WA.
- Current Release: December 4, 2024
- Next Release: December 3, 2025
- Interactive Tables: GDP by county and MSA
- Interactive Maps: GDP by county and MSA
- BEARFACTS BEA Regional Fact Sheet about personal income and gross domestic product
- Comparing County GDP to Personal Income
- Component Counties by State
- Downloadable Data
- Statistical Area Delineations Including Metropolitan and Micropolitan Statistical Areas.
- Glossary
- Economic Information for Coastal Areas
- Industry Names to NAICS Codes
- News Release Archive - GDP by County
- News Release Archive - GDP by Metro
- Data Archive Previously published estimates contain historical data and have since been revised.
What is GDP by County, Metro, and Other Areas?
A comprehensive measure of the economies of counties, metropolitan statistical areas, and some other local areas. Gross domestic product estimates the value of the goods and services produced in an area. It can be used to compare the size and growth of county economies across the nation.
Contact Personnel
-
TechnicalJacob Hinson
-
TechnicalFrank Baumgardner
-
MediaConnie O’Connell

